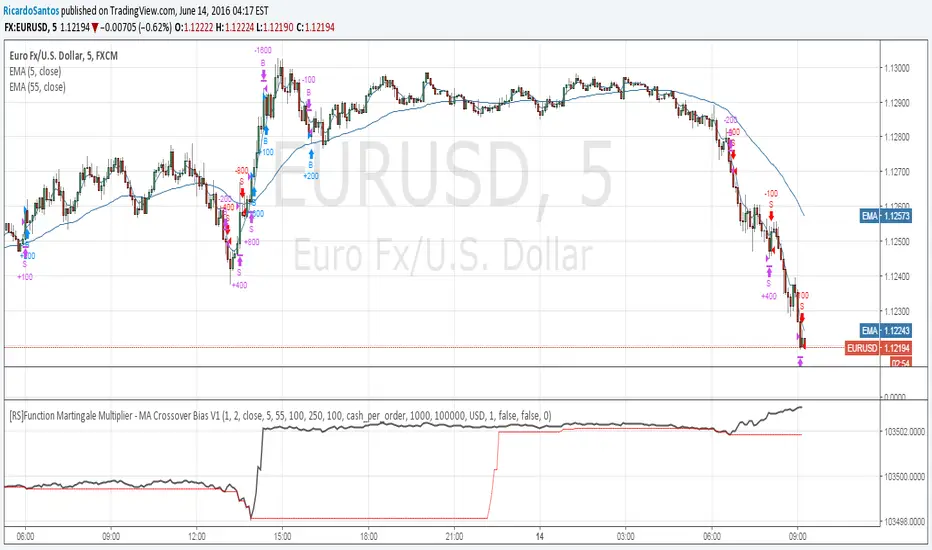
Multi SMA EMA WMA HMA BB (5+5 MAs + Bollinger Bands) MTF by RRBMulti SMA EMA WMA HMA BB (5+5 Moving Averages of Any Type with Bollinger Bands) MTF by RagingRocketBull 2018
Version 1.0
This indicator shows multiple MAs of any type (SMA EMA WMA HMA etc) with BB and MTF support
There are several versions: Simple, MTF, Pro MTF and Ultimate MTF. This is the MTF version. The Differences are listed below. All versions have BB
- Simple: you have 2 groups of MAs that can be assigned any type (5+5)
- MTF: +assign 1 custom Timeframe to any group combo (5+5 Custom TF)
- Pro MTF: +multiple Timeframes for multiple MA groups (4*3 MTF), horizontal levels and show max bars back options
- Ultimate MTF: +individual settings for each MA, multiple Timeframes
There are 2 groups of MAs, 3rd group is BB. You can:
- show/hide all MAs in a group. Use length 0 to hide a particular MA independently or uncheck in Style.
- apply any MA type to all MAs in a particular MA group. For example, you can assign all EMAs the HMA type. Groups are called EMAs and SMAs just for reference.
- assign Custom Timeframe to a particular MA/BB group combination or all groups. For example, show daily (D) EMAs+SMAs on H1 Timeframe, or only H4 (240) BB on H1.
You can use different types of MAs as dynamic S/R levels to trade of off and MA crosses as signals for possible trend change (golden/death bull/bear crosses).
Current Timeframe MAs can be used together with Custom Timeframe MAs on a single chart. Higher TF MAs are more important than lower TF MAs.
Most common MA types are: SMA, EMA, WMA, HMA.
Most common MA lengths are: 12, 20, 26, 30, 50, 100, 200, 400 etc.
MTF Notes:
- Script UI uses simple timeframe textbox instead of input resolution dropdown to allow for 240 120 and other custom TFs
- Groups that are not assigned a Custom TF will use Current Timeframe (0).
- MTF will work for any MA type assigned to the group. BB group always uses SMA type.
- MTF works both ways: you can display a higher TF MA/BB on a lower TF or a lower TF MA/BB on a higher TF.
- MTF MA values are normally aligned at the boundary of their native timeframe. This produces stair stepping when a higher TF MA is viewed on a lower TF.
Therefore Point Density/Smoothing is applied by default on MA MTF for visual aesthetics. Set to 0 to disable and see exact ma mtf values (lines with stair stepping and original mtf alignment).
- Smoothing is disabled for BB MTF because fill doesn't work with smoothed MAs after duplicate values are replaced with na.
- MTF MA Value fluctuation is possible on the current bar due to default security lookahead
Features:
- 2 groups of custom 5+5 MAs of any type including Hull Moving Average (HMA)
- BB
- 1x Custom Timeframe with step line smoothing for 3 groups (MAs + BB)
1. based on 3EmaBB, uses plot, fill, security, change, barstate, stdev and custom hma functions
2. you can't set certain constants from input due to Pinescript limitations - change the code as needed, recompile and use as a private script version
3. you can't have plot* inside ?/if/for/function, and implementing condition forks using 2 sets of plots (na vs non-na) doubles indicator params and styles - confusing
4. swma has a fixed length = 4, alma and linreg have additional offset and smoothing params
Feel free to use. Good Luck!
Search in scripts for "MA Cross"
Multi SMA EMA WMA HMA BB (5+5 MAs + Bollinger Bands) by RRB
Multi SMA EMA WMA HMA BB (5+5 Moving Averages of Any Type with Bollinger Bands) by RagingRocketBull 2018
Version 1.0
This indicator shows multiple MAs of any type (SMA EMA WMA HMA etc) with BB on a chart at the same time with/without MTF support depending on the version.
There are several versions (published later): Simple, MTF, Pro MTF and Ultimate MTF. This is the Simple version. The Differences are listed below. All versions have BB
- Simple: you have 2 groups of MAs that can be assigned any type (5+5)
- MTF: +assign 1 custom Timeframe to any group combo (5+5 Custom TF)
- Pro MTF: +multiple Timeframes for multiple MA groups (4*3 MTF), horizontal levels and show max bars back options
- Ultimate MTF: +individual settings for each MA, multiple Timeframes
You can use different types of MAs as dynamic S/R levels to trade of off and MA crosses as signals for possible trend change (golden/death bull/bear crosses).
Most common MA types are: SMA, EMA, WMA, HMA.
Most common MA lengths are: 12, 20, 26, 30, 50, 100, 200, 400 etc.
Features:
- 2 groups of custom 5+5 MAs of any type including Hull Moving Average (HMA)
- BB
1. based on 3EmaBB, uses plot, fill, stdev and custom hma functions
2. swma has a fixed length = 4, alma and linreg have additional offset and smoothing params
Feel free to use. Good Luck!
Madrid Profit AreaThis study displays a ribbon made of two moving averages identified by a filled Area. This provides visual aids to determine the trend direction and pivot points. The moving average will be Red if its value is decreasing, and green if it is increasing. When both MA's are the same color we have a trend direction. If those are different then we have a trend reversal and a pivot point.
If combined with another ribbon then it can be configured so we have a pair of slow MA's and another pair of fast MA's , this can visually determine if the price is in bull or bear territory following the basic rules:
1. Fast MA pair above the slow MA Pair = Bullish
2. Fast MA pair below the slow MA Pair = Bearish
3. If the fast MA crosses over the slow MA it is a Bullish reversal
4. If the fast MA crosses below the the slow MA, it is a Bearish reversal.
The use of the ribbons without the price bars or line reduces the noise inherent to the price
50-100-200 MA Crosses with Priority (Open Source)Shows MA-EMA-WMA crosses with priority. Also has 2 additional customizable options you can add for scalping and such. It's an open source code so you can change 50-100-200 moving averages to your personal use by just changing the code.
Event-Based Multi MA v1.1📈 Event-Based Multi MA v1.1 — Smart Trading with Dynamic MA Updates
Overview
In a world where most moving averages blindly follow every candle, Event-Based Multi MA v1.1 introduces a smarter logic:
➡️ Update moving averages only when significant price movements occur.
Forget the noise. Focus on what's important.
This indicator recalculates your moving averages only after meaningful price shifts, allowing you to spot true trends and avoid market whipsaws.
Key Features
✅ Event-Driven Logic
Set events based on:
Points: Absolute price change
Percent: Relative price movement
ATR: Volatility-adjusted dynamic movement
✅ Seven Fully Customizable Moving Averages (MA1–MA7)
Each MA offers:
Custom timeframe
Selection of types (EMA, SMA, WMA, VWMA, HMA, LSMA, DEMA, TEMA, ALMA, RMA)
Adjustable lengths and colors
✅ Reduced Market Noise
MAs adjust only after important price actions — cutting down lag and false signals.
✅ Multi-Timeframe Analysis
You can blend moving averages from different timeframes (e.g., 15m, 1H, Daily) into a single chart — perfect for professional multi-frame strategy building.
Settings Explained
Event Trigger Type: Select Points, Percent, or ATR-based movement.
Event Threshold: The amount of price movement needed to trigger a new calculation.
ATR Length: If ATR mode is selected, this controls the sensitivity.
Each Moving Average (MA1 to MA7) has:
MA Type: Choose the smoothing method that suits your trading style.
Length: The number of bars used in the calculation.
Color: Customize visual styling.
Timeframe: Load MAs from different timeframes into your current chart.
How to Use It in Trading
🔹 Trend Confirmation
Wait for event-triggered updates. Fresh MAs after a significant move are much stronger signals than constantly refreshing MAs.
🔹 Momentum Breakouts
Combine short-term (e.g., MA1, MA2) and long-term (e.g., MA5, MA6) MAs. When short-term MAs cross above/below long-term after an event, it's a powerful breakout cue.
🔹 Dynamic Support/Resistance
Use slow-moving MAs like 100-200 length across different timeframes.
The event-based recalculation keeps them relevant to recent major price moves.
🔹 Volatility Filters
Switch to ATR-based events to adapt moving average updates during volatile periods and calm markets.
Why It Beats Traditional Moving Averages
🚀 No More Overfitting to Every Candle
You focus only on impactful price changes.
🚀 Multi-Timeframe Flexibility
Blend micro and macro views seamlessly in one chart.
🚀 Cleaner Signals, Less Noise
Event-triggered recalculations filter out useless minor price wobbles.
🚀 Customization Beyond Standard MAs
TEMA, HMA, ALMA, DEMA, VWMA — all included for ultra-fine-tuned strategies.
✨ Ready to Upgrade Your Trading?
Forget the old, slow MAs.
Use intelligence. Trade events, not noise.
→ Add Event-Based Multi MA v1.1 to your chart and experience true precision!
ICT Swiftedge# ICT SwiftEdge: Advanced Market Structure Trading System
**Overview**
ICT SwiftEdge is a powerful trading system built upon the foundation of ICTProTools' ICT Breakers, licensed under the Mozilla Public License 2.0 (mozilla.org). This script has been significantly enhanced by to combine market structure analysis with modern technical indicators and a sleek, AI-inspired statistics dashboard. The goal is to provide traders with a comprehensive tool for identifying high-probability trade setups, managing exits, and tracking performance in a visually intuitive way.
**Credits**
This script is a derivative work based on the original "ICT Breakers" by ICTProTools, used with permission under the Mozilla Public License 2.0. Significant enhancements, including RSI-MA signals, trend filtering, dynamic timeframe adjustments, dual exit strategies, and an AI-style statistics dashboard, were developed by . We express our gratitude to ICTProTools for their foundational work in market structure analysis.
**What It Does**
ICT SwiftEdge integrates multiple trading concepts to help traders identify and manage trades based on market structure and momentum:
- **Market Structure Analysis**: Identifies Break of Structure (BOS) and Market Structure Shift (MSS) patterns, which signal potential trend continuations or reversals. BOS indicates a continuation of the current trend, while MSS highlights a shift in market direction, providing key entry points.
- **RSI-MA Signals**: Generates "BUY" and "SELL" signals when BOS or MSS patterns align with the Relative Strength Index (RSI) smoothed by a Moving Average (RSI-MA). Signals are filtered to occur only when RSI-MA is above 50 (for buys) or below 50 (for sells), ensuring momentum supports the trade direction.
- **Trend Filtering**: Prevents multiple signals in the same trend, ensuring only one buy or sell signal per trend direction, reducing noise and improving trade clarity.
- **Dynamic Timeframe Adjustment**: Automatically adjusts pivot points, RSI, and MA parameters based on the selected chart timeframe (1M to 1D), optimizing performance across different market conditions.
- **Flexible Exit Strategies**: Offers two user-selectable exit methods:
- **Trailing Stop-Loss (TSL)**: Exits trades when price moves against the position by a user-defined distance (in points), locking in profits or limiting losses.
- **RSI-MA Exit**: Exits trades when RSI-MA crosses the 50 level, signaling a potential loss of momentum.
- Users can enable either or both strategies, providing flexibility to adapt to different trading styles.
- **AI-Style Statistics Dashboard**: Displays real-time trade performance metrics in a futuristic, neon-colored interface, including total trades, wins, losses, win/loss ratio, and win percentage. This helps traders evaluate the system's effectiveness without external tools.
**Why This Combination?**
The integration of these components creates a synergistic trading system:
- **BOS/MSS and RSI-MA**: Combining market structure breaks with RSI-MA ensures entries are based on both price action (structure) and momentum (RSI-MA), increasing the likelihood of high-probability trades.
- **Trend Filtering**: By limiting signals to one per trend, the system avoids overtrading and focuses on significant market moves.
- **Dynamic Adjustments**: Timeframe-specific parameters make the system versatile, suitable for scalping (1M, 5M) or swing trading (4H, 1D).
- **Dual Exit Strategies**: TSL protects profits during trending markets, while RSI-MA exits are ideal for range-bound or reversing markets, catering to diverse market conditions.
- **Statistics Dashboard**: Provides immediate feedback on trade performance, enabling data-driven decision-making without manual tracking.
This combination balances technical precision with user-friendly visuals, making it accessible to both novice and experienced traders.
**How to Use**
1. **Add to Chart**: Apply the script to any TradingView chart.
2. **Configure Settings**:
- **Chart Timeframe**: Select your chart's timeframe (1M to 1D) to optimize parameters.
- **Structure Timeframe**: Choose a timeframe for market structure analysis (leave blank for chart timeframe).
- **Exit Strategy**: Enable Trailing Stop-Loss (`useTslExit`), RSI-MA Exit (`useRsiMaExit`), or both. Adjust `tslPoints` for TSL distance.
- **Show Signals/Labels**: Toggle `showSignals` and `showExit` to display "BUY", "SELL", and "EXIT" labels.
- **Dashboard**: Enable `showDashboard` to view trade statistics. Customize colors with `dashboardBgColor` and `dashboardTextColor`.
3. **Trading**:
- Look for "BUY" or "SELL" labels to enter trades when BOS/MSS aligns with RSI-MA.
- Exit trades at "EXIT" labels based on your chosen strategy.
- Monitor the statistics dashboard to track performance (total trades, win/loss ratio, win percentage).
4. **Alerts**: Set up alerts for BOS, MSS, buy, sell, or exit signals using the provided alert conditions.
**License**
This script is licensed under the Mozilla Public License 2.0 (mozilla.org). The source code is available for review and modification under the terms of this license.
**Compliance with TradingView House Rules**
This publication adheres to TradingView's House Rules and Scripts Publication Rules. It provides a clear, self-contained description of the script's functionality, credits the original author (ICTProTools), and explains the rationale for combining indicators. The script contains no promotional content, offensive language, or proprietary restrictions beyond MPL 2.0.
**Note**
Trading involves risk, and past performance is not indicative of future results. Always backtest and validate the system on your preferred markets and timeframes before live trading.
Enjoy trading with ICT SwiftEdge, and let data-driven insights guide your decisions!
Fractal Pattern AnalysisFractal Pattern Key Elements and How to Read Them
1. Williams Fractals (Triangle Markers)
Red Triangles Pointing Down: Bearish fractals - potential resistance points and selling opportunities
Green Triangles Pointing Up: Bullish fractals - potential support points and buying opportunities
When to Act: Look for bullish fractals forming during uptrends and bearish fractals during downtrends
2. Moving Averages
Yellow Line (20 EMA): Short-term trend
Blue Line (50 EMA): Medium-term trend
Red Line (200 EMA): Long-term trend
Interpretation: When shorter MAs cross above longer MAs, it's bullish; when they cross below, it's bearish
Key Signal: The alignment of all three MAs (stacked in order) confirms a strong trend
3. Background Color
Green Background: Uptrend (all MAs aligned bullishly)
Red Background: Downtrend (all MAs aligned bearishly)
Yellow Background: Sideways/neutral market (MAs not clearly aligned)
4. Market Structure Markers (Small Circles)
Green Circles: Higher highs and higher lows (bullish structure)
Red Circles: Lower highs and lower lows (bearish structure)
Pattern Recognition: Multiple green circles suggest continuing uptrend; multiple red circles suggest continuing downtrend
5. Reversal Diamonds ("Rev" Markers)
Yellow Diamonds: Potential trend reversal points
Usage: These mark where the current trend might be changing direction
Confirmation: Wait for price to close beyond the diamond before acting
6. Bollinger Bands (Blue Lines with Fill)
Middle Band: 20-period SMA
Upper/Lower Bands: Volatility channels
Signals: Price touching upper band in uptrend is strength; touching lower band in downtrend is weakness
Squeeze: When bands narrow, expect a volatility breakout soon
7. Status Table (Top Right)
Shows current trend, volume direction, and overall signal at a glance
"BUY" signal appears when multiple bullish conditions align
"SELL" signal appears when multiple bearish conditions align
TrendTwisterV1.5 (Forex Ready + Indicators)A Precision Trend-Following TradingView Strategy for Forex**
HullShiftFX is a Pine Script strategy for TradingView that combines the power of the **Hull Moving Average (HMA)** and a **shifted Exponential Moving Average (EMA)** with multi-layered momentum filters including **RSI** and **dual Stochastic Oscillators**.
It’s designed for traders looking to catch high-probability breakouts with tight risk management and visual clarity.
Chart settings:
1. Select "Auto - Fits data to screen"
2. Please Select "Scale Price Chart Only" (To make the chart not squished)
### ✅ Entry Conditions
**Long Position:**
- Price closes above the 12-period Hull Moving Average.
- Price closes above the 5-period EMA shifted forward by 2 bars.
- RSI is above 50.
- Stochastic Oscillator (12,3,3) %K is above 50.
- Stochastic Oscillator (5,3,3) %K is above 50.
- Hull MA crosses above the shifted EMA.
**Short Position:**
- Price closes below the 12-period Hull Moving Average.
- Price closes below the 5-period EMA shifted forward by 2 bars.
- RSI is below 50.
- Stochastic Oscillator (12,3,3) %K is below 50.
- Stochastic Oscillator (5,3,3) %K is below 50.
- Hull MA crosses below the shifted EMA.
---
## 📉 Risk Management
- **Stop Loss:** Set at the low (for long) or high (for short) of the previous 2 candles.
- **Take Profit:** Calculated at a risk/reward ratio of **1.65x** the stop loss distance.
---
## 📊 Indicators Used
- **Hull Moving Average (12)**
- **Exponential Moving Average (5) **
- **Relative Strength Index (14)**
- **Stochastic Oscillators:**
- %K (12,3,3)
- %K (5,3,3)
Vulkan Profit
Overview
The Vulkan Profit indicator is a trend-following tool that identifies potential entry and exit points by monitoring the relationship between short-term and long-term moving averages. It generates clear buy and sell signals when specific moving average conditions align, making it useful for traders looking to confirm trend changes across multiple timeframes.
How It Works
The indicator utilizes four different moving averages:
Fast WMA (period 3) - A highly responsive weighted moving average
Medium WMA (period 8) - A less sensitive weighted moving average
Fast EMA (period 18) - A responsive exponential moving average
Slow EMA (period 28) - A slower exponential moving average
These moving averages are grouped into two categories:
Short-term MAs: Fast WMA and Medium WMA
Long-term MAs: Fast EMA and Slow EMA
Signal Generation Logic
The Vulkan Profit indicator generates signals based on the relative positions of these moving averages:
Buy Signal (Green Triangle)
A buy signal appears when the minimum value of the short-term MAs becomes greater than the maximum value of the long-term MAs. In other words, when both short-term MAs cross above both long-term MAs.
Sell Signal (Red Triangle)
A sell signal appears when the maximum value of the short-term MAs becomes less than the minimum value of the long-term MAs. In other words, when both short-term MAs cross below both long-term MAs.
Visual Components
Moving Averages - All four moving averages can be displayed or hidden
Signal Arrows - Green triangles for buy signals, red triangles for sell signals
Colored Line - A line that changes color based on the current market stance (green for bullish, red for bearish)
Customization Options
The indicator offers several customization settings:
Toggle the visibility of moving averages
Toggle the visibility of buy/sell signals
Adjust the color, width, and position of the signal line
Choose between different line styles (Line, Stepline, Histogram)
Practical Trading Applications
Trend Identification: The relative positioning of all moving averages helps identify the current market trend
Entry/Exit Points: The buy and sell signals can be used as potential entry and exit points
Trend Confirmation: The colored line provides ongoing confirmation of the trend direction
Filter: Can be used in conjunction with other indicators as a trend filter
Trading Strategy Suggestions
Trend Following: Enter long positions on buy signals and exit on sell signals during trending markets
Confirmation Tool: Use the signals to confirm trades identified by other indicators
Timeframe Analysis: Apply the indicator across multiple timeframes for stronger confirmation
Risk Management: Place stop-loss orders below recent swing lows for long positions and above recent swing highs for short positions
Tips for Best Results
The indicator performs best in trending markets and may generate false signals in ranging or highly volatile markets
Consider the broader market context before taking trades based solely on these signals
Use appropriate position sizing and risk management regardless of the indicator's signals
The longer timeframes generally produce more reliable signals with fewer false positives
The Vulkan Profit indicator combines the responsiveness of short-term averages with the stability of long-term averages to capture significant trend changes while filtering out minor price fluctuations.
[TABLE] Moving Average Stage Indicator Table📈 MA Stage Indicator Table
🧠 Overview:
This script analyzes market phases based on moving average (MA) crossovers, classifying them into 6 distinct stages and displaying statistical summaries for each.
🔍 Key Features:
• Classifies market condition into Stage 1 to Stage 6 based on the relationship between MA1 (short), MA2 (mid), and MA3 (long)
• Provides detailed stats for each stage:
• Average Duration
• Average Width (MA distance)
• Slope (Angle) - High / Low / Average
• Shows current stage details in real-time
• Supports custom date range filtering
• Choose MA type: SMA or EMA
• Optional background coloring for stages
• Clean summary table displayed on the chart
STH Unrealized Profit/Loss Ratio (STH-NUPL) | [DeV]STH-NUPL
The Short-Term Holder Net Unrealized Profit/Loss Ratio (STH-NUPL) is an analytical tool designed to approximate the unrealized profit or loss of Bitcoin’s short-term holders (STHs)—typically those holding coins for less than 155 days—within the constraints of TradingView’s price-based environment. Drawing inspiration from the canonical STH-NUPL metric, which assesses the difference between the market value and realized value of STH-held coins, this indicator adapts the concept into a normalized ratio using Bitcoin’s price data as a proxy. It offers a window into the sentiment and behavior of short-term market participants, who are often more sensitive to price fluctuations than long-term holders.
In its raw form, STH-NUPL oscillates around a break-even threshold of 0, where positive values indicate aggregate unrealized profits for STHs (market value exceeds realized value), and negative values suggest losses. This inflection point frequently acts as a key level: in bear markets, it can signal capitulation as STHs sell at break-even or below, while in bull markets, it may reflect reluctance to realize losses, providing support. The indicator enhances this metric with smoothing, a moving average overlay, and sophisticated visualization options, delivering a statistically informed perspective on short-term holder dynamics tailored for institutional-grade analysis.
STH-NUPL Settings -
Lookback Length (Default: 150 days): Defines the SMA period for estimating realized value. This 150-day window aligns with traditional STH definitions (e.g., <155 days), capturing a broad yet relevant historical cost basis for short-term holders, ideal for assessing cyclical behavior.
Smoothing Period (Default: 5 days): Applies an EMA to the raw STH-NUPL ratio, with a short default period to maintain responsiveness to recent price shifts while filtering out daily volatility. This setting is particularly suited for tactical analysis.
Moving Average Settings -
MA Lookback Length (Default: 90 days): Sets the period for the STH-NUPL’s moving average, offering a medium-term trend signal that contrasts with the 150-day lookback, enabling detection of momentum shifts within broader market phases.
MA Type (Default: EMA): Provides six moving average types, from the straightforward SMA to the volume-sensitive VWMA. The default EMA balances smoothness and reactivity, while options like HMA or VWMA cater to specialized needs, such as emphasizing recent action or volume trends.
Display Settings -
Show Moving Average (Default: True): Toggles the visibility of the STH-NUPL MA plot, allowing users to focus solely on the smoothed ratio when desired.
Show Background Colors (Default: True): Activates dynamic background shading to visually reinforce market regimes.
Background Color Source (Default: STH-NUPL): Enables users to tie the background to either the STH-NUPL’s midline (reflecting sthNupl > 0) or the MA’s trend direction (maNupl > maNupl ), aligning the visual context with the chosen analytical focus.
Analytical Applications -
Bear Market Capitulation: When the smoothed STH-NUPL approaches or falls below zero, it often signals loss realization among STHs, a precursor to capitulation in downtrends. A declining MA crossing zero can confirm this selling pressure.
Bull Market Support: Positive STH-NUPL values with a rising MA indicate STHs are in profit and reluctant to sell at a loss, forming support zones in uptrends as sell pressure wanes.
Sentiment Extremes: Significant deviations above or below zero highlight over-optimism or despair among STHs, offering contrarian opportunities when paired with price action or other on-chain metrics.
**Limitations**
As a TradingView-based approximation, this indicator uses price data (close) rather than true on-chain STH supply and realized price, which are available through providers like Glassnode. The 150-day SMA for realized value simplifies the cost basis, potentially underrepresenting the diversity of STH transactions. Despite this, the smoothed ratio and moving average overlay provide a practical proxy for tracking STH sentiment within TradingView’s ecosystem.
Spent Output Profit Ratio (SOPR) Z-Score | [DeV]SOPR Z-Score
The Spent Output Profit Ratio (SOPR) is an advanced on-chain metric designed to provide deep insights into Bitcoin market dynamics by measuring the ratio between the combined USD value of all Bitcoin outputs spent on a given day and their combined USD value at the time of creation (typically, their purchase price). As a member of the Realized Profit/Loss family of metrics, SOPR offers a window into aggregate seller behavior, effectively representing the USD amount received by sellers divided by the USD amount they originally paid. This indicator enhances this metric by normalizing it into a Z-Score, enabling a statistically robust analysis of market sentiment relative to historical trends, augmented by a suite of customizable features for precision and visualization.
SOPR Settings -
Lookback Length (Default: 150 days): Determines the historical window for calculating the Z-Score’s mean and standard deviation. A longer lookback captures broader market cycles, providing a stable baseline for identifying extreme deviations, which is particularly valuable for long-term strategic analysis.
Smoothing Period (Default: 100 days): Applies an EMA to the raw SOPR, balancing responsiveness to recent changes with noise reduction. This extended smoothing period ensures the indicator focuses on sustained shifts in seller behavior, ideal for institutional-grade trend analysis.
Moving Average Settings -
MA Lookback Length (Default: 90 days): Sets the period for the Z-Score’s moving average, offering a shorter-term trend signal relative to the 150-day Z-Score lookback. This contrast enhances the ability to detect momentum shifts within the broader context.
MA Type (Default: EMA): Provides six moving average types, from the simple SMA to the volume-weighted VWMA. The default EMA strikes an optimal balance between smoothness and responsiveness, while alternatives like HMA (Hull) or VWMA (volume-weighted) allow for specialized applications, such as emphasizing recent price action or incorporating volume dynamics.
Display Settings -
Show Moving Average (Default: True): Toggles the visibility of the Z-Score MA plot, enabling users to focus solely on the raw Z-Score when preferred.
Show Background Colors (Default: True): Activates dynamic background shading, enhancing visual interpretation of market regimes.
Background Color Source (Default: SOPR): Allows users to tie the background color to either the SOPR Z-Score’s midline (reflecting adjustedZScore > 0) or the MA’s trend direction (zScoreMA > zScoreMA ). This dual-source option provides flexibility to align the visual context with the primary analytical focus.
Analytical Applications -
Bear Market Resistance: When the Z-Score approaches or exceeds zero (raw SOPR near 1), it often signals resistance as sellers rush to exit at break-even, a pattern historically observed during downtrends. A rising Z-Score MA crossing zero can confirm this pressure.
Bull Market Support: Conversely, a Z-Score dropping below zero in uptrends indicates reluctance to sell at a loss, forming support as sell pressure diminishes. The MA’s bullish coloring reinforces confirmation of renewed buying interest.
Extreme Deviations: Values significantly above or below zero highlight overbought or oversold conditions, respectively, offering opportunities for contrarian positioning when paired with other on-chain or price-based metrics.
SemaforThis is the 4 Level Semafor indicator with Daily Open Line and Average Session Range. Also on the chart is the EMA Ribbon indicator.
Credit to:
Devlucem for the Semafor indicator
Quantvue for the Average Session Range
Shusterivi for the Daily Open Line
MYNAMEISBRANDON for the EMA Ribbon
The Semafors are based on the ZigZag indicator and show higher highs/lower lows of a specified period, determined by the user and applied in settings.
The default periods I use are:
10 period (hidden on this chart)
50 period-blue dots
250 period-white dots
615 period-black dots
Just as the ZigZag indicator will recalculate so to will the semafors, as additional candles are built. The semafor indicator is never to be used as a stand alone signal. It must be combined with other indicators to be used effectively. What we look for are the semafor patterns of a large white dot followed by a 1st blue dot opposite of the white. Then a 2nd blue dot in agreement with the white dot. In theory, the 2nd blue dot is seen as confirmation of the establishment of the white semafor..
When combined with Daily Open Line, ADR (Average Sessions Range), EMA cross and VWAP anchored to your 250 semafors, your odds are greatly increased. Add to that the knowledge of basic market structure and the wisdom that comes from patience and you have a very powerful weapon.
The Daily Open...I trade the M1 chart and also draw a H4 Open Line on my chart for the smaller time frames. Price will tend to trade away from the Daily Open Line. In many cases until it reaches certain levels...Fib, Gann, ADR, etc., then runs through a pullback cycle. I like the ADR levels. The ADR can give clues when entering a consolidation phase, ie trading between the buy side and sell side 15% levels. Trading away from the Daily Open(or H4 open) along with breaking the 15% level, while in agreement with a semafor pattern is a good sign.
Add to that confluence the agreement of your MA cross and the 250 semafor Anchored VWAP and you have a solid signal to help determine your actions. This trend following layout will work on any time frame. I just really like the M1 for its precision, not for crazy back and forth all day. With the exception of some strong pull back signals, I don't enter any more trades on the M1 than on M5, 15 or 30.
This is based on and follows the teachings of Xard and his trading strategy. Just as I don't want to take anyone's credit for these indicators, I won't take credit for what I have been taught either.
The trader can obviously use their favorite MA cross indicator. But this one is visually beautiful AND displays the current time frame and 1 time frame higher on the chart...awesome!
Of note, I do run into trouble at times with the 615 period semafor. I have been told it is because TradingView has trouble with extended period indicators. As a matter of fact, I would like a much higher period for my biggest semafor. I would like it set at 1250, but that seems to be a no starter. If anyone has a solution, that would be welcomed news.
Options Series - Technical Analysis Chart➤ Simple Technical Chart Only:
➤ With MA-20 Overlay and Volatility background bars:
➤ With RSI Candles:
⭐ Overview and How It Works:
This script provides a multi-asset analysis tool to assess various market conditions across four symbols simultaneously. It combines several indicators such as daily price change, Moving Averages (MA), Bollinger Bands (BB), Parabolic SAR, RSI, and VWAP to generate buy/sell signals and trend indicators. Its strength lies in the layered use of indicators to enhance signal reliability, making it valuable for traders needing cross-validation in decision-making.
⭐ Key Features and Functionality:
The script evaluates each symbol's price against various indicators and conditions:
Daily Price Conditions: It checks if each symbol’s close price is above or below the previous day’s open, close, and intra-day ranges, forming a foundational bullish/bearish condition.
Range Breakout 1st 5min Candle (ORB): Opening Range Breakout levels are calculated and compared with current close prices, detecting breakout/breakdown conditions.
ORB Body: This basically calculates the previous day Daily candle body size, if todays Daily candle body size is greater than previous day, then we can say that we are having good momentum else its likely to be in-sidebar trading.
Moving Averages (MA): It leverages EMA-20, 2-day, and 3-day exponential moving averages to gauge short to medium-term trends.
RSI and VWAP: Relative Strength Index (RSI) determines overbought or oversold conditions, while VWAP compares prices to volume-weighted levels.
Bollinger Bands and Trend Analysis: Detects volatility and potential breakout conditions.
Concept of ORB Body:
Current_PrevDay_Body = (math.max(var_Current_PrevD_Open, var_Current_PrevD_Close) - math.min(var_Current_PrevD_Open, var_Current_PrevD_Close))
Current_Upper_ORB = var_Current_D_Open + Current_PrevDay_Body
Current_Lower_ORB = var_Current_D_Open - Current_PrevDay_Body
Current_TodayDay_Body = math.max(var_Current_D_Open, var_Current_Close) - math.min(var_Current_D_Open, var_Current_Close)
Current_ORBBody = Current_TodayDay_Body > Current_PrevDay_Body
Current_Upper_ORB_bull = (var_Current_Close > Current_Upper_ORB)
Current_Lower_ORB_bear = (var_Current_Close < Current_Lower_ORB)
🎨 Visualizations and User Experience:
The script can dynamically display colored backgrounds indicating trends when conditions are met. For example, the bgcolor function changes the background when certain trend-based criteria are satisfied, offering visual cues to users. Additionally, the checkbox input toggles trend bar visualizations, enhancing user experience by providing a quick visual reference without needing to interpret individual data points manually.
RSI-Based Candle Coloring:
➤ The script customizes candle colors based on RSI thresholds, specifically defining upper (60) and lower (40) RSI levels. When the RSI value exceeds the upper threshold, candles are colored as bullish (green), and if it falls below the lower threshold, candles are colored as bearish (red). Neutral RSI values result in a default color (gray).
➤ This setup offers a visually intuitive way to identify potential trend directions based on RSI levels, making it ideal for traders looking to gauge momentum visually.
⭐ Settings and Customization:
With multiple user-configurable inputs, the script allows for tailored analysis. Customizable parameters, such as enabling/disabling trend bars and setting various look-back periods for indicators like Bollinger Bands and Moving Averages, make it adaptable to various trading styles and preferences. It also allows users to modify visual elements like colors and styles, improving flexibility.
⭐ Uniqueness of the Concept:
The unique aspect of this script is its multi-symbol approach combined with complex conditions. By comparing not only one but four symbols simultaneously, it provides a broader market view and allows traders to correlate signals across different assets, offering a potential edge for diversified or comparative strategies. Additionally, the incorporation of ORB and multi-timeframe MAs gives it a robustness often lacking in simpler single-symbol scripts.
🚀 Conclusion:
This script is a powerful multi-indicator tool suited for traders looking for a comparative, multi-symbol analysis. With features like ORB, Bollinger Band-based trend detection, and MA cross-verification, it can assist traders in identifying and validating trend signals across assets. The user-friendly visualizations and customizable settings further enhance its usability, making it versatile for various trading strategies and preferences.
GoGoGadget MA RibbonMoving Average Ribbon with defaults for day-trading
8, 21, 50 EMAs
MA cross(over/under) markers
MA cross(over/under) alert conditions preconfigured
Reversal time periods highlight background or add labels for periods on standard days when reversals are likely (mainly useful for SPY or QQQ)
Dynamic ADX - [The Pine Guru]Dynamic ADX by The Pine Guru
What is the Dynamic ADX?
The Dynamic ADX is an indicator created using the regular ADX, Line, and additional ADX Moving Average. This MA allows the script to calculate the ADX differently to the original ADX, providing greater input and accessibility to the user. As the ADX is a volatility indicator, it is communicates to trend strength in the markets. The Dynamic ADX displays these trending Periods through user controlled visualizers like Fills, Background Color, and Bar Color.
How do I use the Dynamic ADX?
This indicator has 4 different "versions" or "conditions" in which it displays trend strength. These are achieved by checking and unchecking ADX, ADX MA and Line. Different combinations of these 3 inputs will result in a change of true condition that the script outputs.
Dynamic ADX Achieved by checking the ADX and ADX MA, results in an ADX similar to an MA Crossover, with the ADX being over the MA indicating a true or strong trend condition.
Regular ADX Achieved by Checking the ADX and Line. Results in the regular calculation of the ADX.
Mixture Achieved by Checking all three sections, which results in the calculation a normal ADX as well as the MA. Provides and extra condition or confluence into the ADX.
MA and Line Achieved by checking the ADX MA and Line. Results in a similar calculation to an original ADX but with a smoother MA.
Recommendations
This indicator will work typically in all markets with high volume and volatility. It is recommended that it is used as a confluence in a trading system, and not as an outright indicator. As always do your own testing before live use with this indicator. Do your own Research and refinements.
Please Leave a like if you enjoy this Indicator
Intraday JXMODI CrossCombination of two strategy.
MA Cross strategy + RSI strategy to decide whether the stock/crypto is currently overbought/oversold.
RSI alert when change from bull to bear, and vice verse.
Useful for quick entry and exit trade.
Whenever RSI Black color line Cross Red color MA line , Trend Changes.
For Bull side Trade on High of that candle & Stoploss Low of that candle in which Cross Occurs.(Green Shadow)
For Bear side Trade on Low of that candle & Stoploss High of that candle in which Cross occurs.(Red Shadow)
For more confirmation use SuperTrend etc indicators.
adx efi 50 ema channel, trend pullbackHi so this strategy is based off 50 ema channel and the 15 ma crossing it to generate signals. But with my adjusted strategy it's a 10 rma crossing 50 ema channels and a 5 and 9 wma to help see pullbacks. 50 period bollinger bands to gage volatility a0nd help during range markets. The strategy signals are generated when longer period efi is above 0 and shorter period efi is below zero and price has pulled back near 50 ema to buy long. And the reverse for shorts, I made this to help me trade more mechanically and to trade 1 minute time frame, that's where the strategy seems to Excell the most, I developed it on eur usd but a brief check seems like it still is profitable on gbp usd aud usd usd jpy I only trade the forex market so not sure about stocks and crypto. If you get signals I would place buy stops and sell stops above high and low of respective signal candle and let price take you into trade. Also adx 20 has to be greater than 20 to take trades. Let me know if this is helpful. I've only been coding for a month so it might look sloppy the way it's coded also there are a few other buy and sell conditions left in the source code if you want to switch between different buy and sell triggers, they all produce good results on 1 min timeframe
ViVen - Multi Time Frame - Moving Average StrategyHi Traders,
Indicator Description : Multiple Time Frame Moving Average lines in One Chart.
Moving Average Types : SMA, WMA, EMA
Moving Average Period : 20 Default (Variable up to 200)
MA Time Frame : 1m, 3m, 5m, 15m, 30m, 1Hr, Daily, Weekly, Monthly (All lines in one chart)
You can turn ON/OFF the moving average lines based on your requirement.
Moving Average Table : The table will give you an idea where the price is currently trading (LTP), if the price is above any of the moving average then it will show you the Price is above MA and wise versa.
Trading Method:
Monthly, Weekly, Daily and 1Hr Moving averages will tell you whether the script is in Bullish Trend or Bearish Trend.
Basically the moving averages will act as Support and Resistance Levels. With candle confirmation you can take trade.
Ready to Take Position - When 1m MA Crosses 3m MA (Upside / Downside)
BUY Strategy:
"Buy" - when 3m MA breaks 5m moving average on the upside. (Intraday/Scalp)
"Hold" - when 5m MA breaks 15m MA on the upside.
"Strong Hold" - when 15m MA breaks 1Hr MA on the upside for Long term.
"Exit" - when 3m MA breaks 5m MA on the Downside.
SELL Strategy:
"Sell" - when 3m MA breaks 5m moving average on the Downside. (Intraday/Scalp)
"Hold" - when 5m MA breaks 15m MA on the Downside. (Intraday)
"Strong Hold" - when 15m MA breaks 1Hr MA on the Downside. (Positional).
"Exit" - when 3m MA breaks 5m MA on the Downside.
If you agree with this strategy and works well please like this script, share it with your friends and Follow me for more Indicators.
In the next Version, I will come up with Strategy table that I have explained here.
Thanks for your support.
_CM_Ultimate_MA_MTF_V4***For a Detailed Video Overview Showing all of the Settings...
Click HERE to View Video
New _CM_Ultimate_MA_MTF_V4 - Update - 08-24-2021
Thanks to @SKTennis for help with code
Added Ability to Plot 1 or 2 Moving Averages - Fast MA & Slow MA
Added Ability to Plot Fast MA with Multi TimeFrame
Added Ability to Plot Slow MA with Multi TimeFrame
Added Ability to Color Fast MA Based on Slope of MA
Added Ability to Color Fast MA based on being Above/Below Slow MA
Added Ability to Plot 8 Types of Moving Averages
Simple, Exponential, Weighted, Hull, VWMA, RMA, TEMA, & Tilson T3
Added Ability to Set Alerts Based on:
Slope Change in the Fast MA Or Fast MA Crossing Above/Below Slow MA.
Added Ability to Plot "Fill" if Both Moving Averages are Turned ON
Added Ability to control Transparency of Fill
Added Alerts to Settings Pane.
Customized how Alerts work. Must keep Checked in Settings Pane, and When you go to Alerts Panel, Change Symbol to Indicator (_CM_Ultimate_MA_MTF_V4)
Customized Alerts to Show Symbol, TimeFrame, Closing Price, & Moving Average Signal Name in Alert
Alerts are Pre-Set to only Alert on Bar Close
See Video for Detailed Overview
New Updates Coming Soon!!!
***Please Post Feedback and Any Feature Requests in the Comments Section Below***
VWMA with kNN Machine Learning: MFI/ADXThis is an experimental strategy that uses a Volume-weighted MA (VWMA) crossing together with Machine Learning kNN filter that uses ADX and MFI to predict, whether the signal is useful. k-nearest neighbours (kNN) is one of the simplest Machine Learning classification algorithms: it puts input parameters in a multidimensional space, and then when a new set of parameters are given, it makes a prediction based on plurality vote of its k neighbours.
Money Flow Index (MFI) is an oscillator similar to RSI, but with volume taken into account. Average Directional Index (ADX) is an indicator of trend strength. By putting them together on two-dimensional space and checking, whether nearby values have indicated a strong uptrend or downtrend, we hope to filter out bad signals from the MA crossing strategy.
This is an experiment, so any feedback would be appreciated. It was tested on BTC/USDT pair on 5 minute timeframe. I am planning to expand this strategy in the future to include more moving averages and filters.
Coinbase to Binance premium indicator/strategy
1) Offers bar/ma chart of premium
2) Offers different trading strats based on premium(ma cross, premium value cross, smoothed premium value cross)
supersmoother code credited to someone else from tradingview
Flunki T-WAP minus MA Oscillator
Yo,
Possible the last of these for now, and mostly for the sake of completeness..
This is..
Another simple oscillator that show the difference in price between a selectable timeframe TWAP and a Moving Average of that TWAP
This is shown as a histogram.
Use numeric TWAP values for minutes (30, 60 ,720 whatever) and D, 3D, W, M for higher values
There is also a global timeframe which will set the timeframe for a global alternate timeframe (instead of current chart resolution)
On top of that is a Moving Average of the histogram value, shown as a blue / red line with an option to highlight this MA crossing zero, and an option to colour bars to this line.
The major difference between this Oscillator, and the other script (Flunki VWAP minus MA Oscillator)
(I treid to insert a link but it's invisible so it would seem, anyway.. )
is that VWAP is usually calculated daily, so there is a sharp move upon the daily close, as VWAP starts a new day. Using TWAP this does not occur, so gives smoother transitions ; also the timeframe for TWAP is selectable for additional wap fun.
Simple idea : Code open
Enjoy !